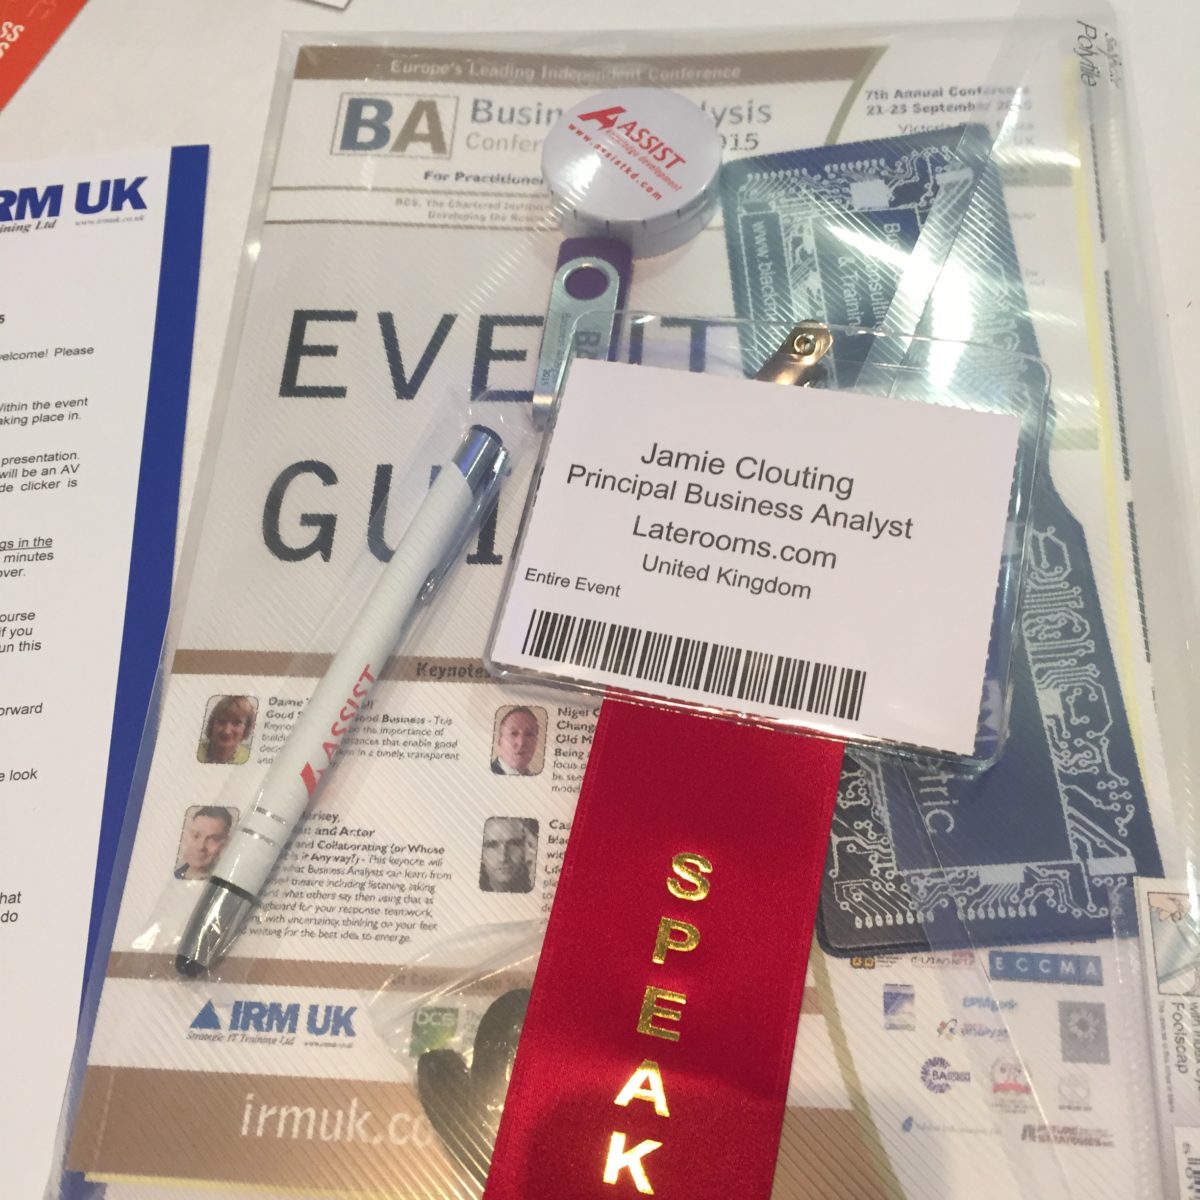
One of the great things I get to do as the Principal Business Analyst at Laterooms.com is attend events and engaging with the BA community, promoting the great work that we do here and identifying quality people who share a passion for analysis and want to join our growing BA Practice.
I’m doing a bit of a tour of the country to attend some of the IIBA branch events and meet more of the community, learn some new skills and get inspired by some of the amazingly talented Business Analysts up and down the country.
If you’re about for any of the following events, come and find me and have a chat:
We’re really excited for the opportunity to present and to represent Laterooms.com at such a great event. Previous years conferences have been critical in my development as a BA and I’m thrilled to be speaking there for the first time this year.
If you’re going to be attending, give me a shout!
Synopsis
Delivering value is at the heart of the Business Analyst role, but how easy is it to identify tangible value and prove the success of a project or program?
In agile projects we’ll often define a “definition of done” or ask the question “what does success look like”. At LateRooms.com, we’ve developed a toolkit for our Business Analysts to support the business in using data to define what success looks like, and track it throughout the project lifecycle.
This presentation will look at the ways LateRooms.com collects, analyses and uses data to better define the problem space, setup up KPI driven Critical Success Factors and present Benefits Realisation.
The session will cover:
Leveraging the most out of the data you already have
Setting up baselines and real-time KPI dashboards
Making better decisions from your data
Presenting Benefits Realisation in a way the business will understand
To hear my talk on this topic you check out my SoundCloud.
Over the past couple of years I have seen a growing trend in BAs and product teams striving to define what ‘success looks like’. It’s comes from a desire within the business to understand how we’ll know when we’ve achieved what we set out to do and what the world will look like at the finish line.
I think it’s worth recognising that there are probably a collection of terms out there that describe similar things here. You may call the, Critical Success Factors in your organisation and have associated KPIs.
If you’re working in a Scrum team you may refer to theses as the Definition of Done, a series of criteria or success factors that must be met in order for something to be considered as completed, as done.
The closest I could find in the BABOK about measuring success was in chapter 6.3 Specify and Model Requirements [1]:
The activity of analysing expressed stakeholder desires and/or the current state of the organization using a combination of textual statements, matrices, diagrams and formal models
I’m a real advocate of this approach and have found it resonates well with the product team I sit in, as together we defining a testable state in which to measure if we have achieved our intended goal. This is similar to the team’s approach in writing software, where they will write tests that fail, prior to writing a line of code. They then write software that passes the tests that were defined. Once all the tests pass the project is finished.
However, too often I think BA’s try and define success far too late in a projects life cycle and as a result, miss out on being able to show real business value early in the process.
Lean Statup
Many of you may have heard of Eric Ries and Lean Startup. You may have discredited it as applying to your organisation, as you’re not a startup, but I believe that everyone can use Lean Startup principles in their work, especially business analysts.
Eric discusses in his book, The Lean Startup, a new approach to testing hypothesis to help innovation. I believe we can use this same approach when identifying the impact of problems we uncover in our projects, whether it is a bug, an inefficient process or a missed deadline. And using the same principles we can continual measure for the improvements made as we get to work on tackling those issues.
Measuring failure, the “as is” state
So before we can measure what success looks like I encourage people to re-frame the problem. I ask them what failure looks like, often to their surprise. What I mean is, if we did nothing to resolve this issue what would the cost or impact top the business be. This may cause them to go and collect some information in order to answer this, but chances are they have a good idea and can articulate it.
This is a great place to start and will have many other benefits that can feed your product vision, and even help with ROI calculations further down the line.
Once you understand the problem or opportunity, you can start to consider solutions for achieving your goals, but how will we know that we’ve actually been successful?
If you work for a company that sells products online it may be easy for you to measure success. If you sell more items or increase your profit on what you sell, you’ve clearly been successful and perhaps these are some of the most obvious ways of measuring success and may not require models or equations to prove it.
However, if your project doesn’t have an obvious revenue stream to measure, you may need to be a little more creative with what you measure – and this I think, is where Business Analyst can really take a lead.
Have you ever considered the impact your project may have on customer satisfaction? Do you know what your current customer satisfaction score is and would you know how to measure it? Do you know where you rank amongst competitors, especially the ones that you are chasing for market share? I’m willing to bet someone in your organisation already knows the answer to all of those questions!
Do you know how long a manual process takes to run in your organisation? If you could identify improvements then you could calculate an efficiency saving to the business in terms of employee cost or an increase in productivity per employee.
Now measurement isn’t just something that we do at the end of projects. I often hear of the Definition of Done or the definition of what success looks like as being the finish line of a race that once crossed, means the project is closed. While this is true, I sort of dislike the analogy as it suggests it’s the last thing that happens in a project. I believe measuring success is a continuous process. if the definition of what success looks like is our finish line we measure at every step along the race course asking the question, have we crossed the line? Have we improved revenue, have we improved customer satisfaction? For teams that work on incremental delivery strategies, this data is crucial in checking that the team are going in the right direction and if they’re not this data will help support the need for changing direction or pivoting. This in itself is ensuring project success by getting early visibility of failure and risks.
Change, measure, change, measure…
So I’ve explained how I think measuring should take place at every step of the journey and how “what success looks like” is the finish line, the goal we’re aiming for. But in reality the improvements and gains that we see from the success of our projects don’t end once we cross that finish line. If you’ve managed to see an increase of 2% in sales as a result of your project, that’s for life. The business will continue to see that additional value month on month and as a BA I think it’s important that we shout about success and recognise the value that we as BA’s and the teams we support add to the organisation we live in. Everyone likes to have evidence they can show their boss that the project they’ve delivered was successful… And if it over achieved, how pleased will you be that you were tracking the data from day 1!
Conclusion
So to conclude I want to just recap on what I’ve said and recommend some further reading:
Measuring success is linked right back to your initial requirements and stakeholder desires. You’re helping your team prove that they’ve been met with real data
Measuring success is a continuous process, measuring it at the end is too late… you could be miles off and have not known
Measuring success continuously reduces risk and allows for innovation and agility
Evidence of success is the best reward of all, and will really help you as a BA
So I’ve not had chance to update my blog recently. A lot has changed in the months that I’ve been away…
Earlier in October I took up a new and exciting role at Laterooms.com, the UK’s leading hotel booking company. It’s an exciting role for a number of reasons:
I’ll be joining a team of 10 other great BAs, so expect more posts and maybe even some collaborations
It allows be to focus on a single product, or at least a single organisation for a while
It’s based right here in Manchester, so I can balance work and home life a little better
The job move coincides with a house move too. Then family and I have moved to a larger house with plenty of room for the kids to grow up in. We’re still surrounded by boxes but as soon as we’re settled I’ll be blogging again.
Some blog posts coming up include:
Paper prototyping with the UX stencil
Writing effective User Stories for backend systems and APIs
Defining success and measuring business benefits
Decoupling UX from Development in Scrum
If anyone has any blog requests please let me know.
Recently I gave a presentation on Agile Estimation, as based on some of the material cover in the course I attended. While I can not take credit for the materials, or the activities, I was keen to write about them as I believe my own perspective could be of benefit to others who find themselves in a similar situation.
Estimation is something that every team does, but approaches vary wildly. Commonly developers will estimate in hours based on their feel for how long a task or activity will take. While this is not terrible the individual doing the estimating makes a number of assumptions about their approach, their experiences of similar tasks, their confidence in finding a solution, the risk involved, etc. However, what if the person that has done the estimate isn’t the person who will complete the task? What if they aren’t aware of the assumptions made and are not able to understand how the estimate was so low or high?
In the session I asked the teams to estimate the distance from our office to Paris. Instantly they started working on understanding the distance, what roads they would need to take, a ferry or a train and if they would need to sleep on the way. Within a very small variance the teams were pretty consistent in the distance it was from our office to Paris. However, when they started to estimate the time required, based on their distance estimate, the hours varied based on speed assumptions, accounting for traffic and other variables.
What I was trying to show the team is that most of us are good at judging the complexity of a task. They were all good at determining the distance, the route and even the car they’d take and those that had driven the route before knew more confidently what the number of miles required to drive.
When teams decouple complexity estimates from duration estimates they are usually more accurate. Even for the guys that had driven to Paris before, the number of miles required to drive was not smaller in any way, the size or complexity of the task didn’t change for them.
Mike Cohn teaches that we should
Estimate size and derive duration
Mike Cohn
You see duration or velocity is something that a team understands best through practice. Once teams get into a rhythm or cadence they naturally start working more effectively. This will improve the speed that they are working at and the number of tasks that they can complete.
By estimating as a team (or at least in pairs) developers will at least get some peer input into if their estimates to help them check they are in the right sort of range. And through conversation and repeated estimates the teams should see an improved confidence in their estimate ranges.
For more on Agile Estimating & Planning check out Mike Cohn’s book. A must read for anyone who is moving into planning and managing agile projects for the first time. Mike packs the book full of helpful lessons learnt from over 20 years in the field.
Last month I attended a fantastic course to become a Certified Scrum Product Owner (CSPO) with the legendary Mike Cohn.
What are Product Owners?
To quote the Scrum Alliance:
“Certified Scrum Product Owners® have been taught the Scrum terminology, practices, and principles that enable them to fulfill the role of Product Owner on a Scrum team. CSPOs are typically the individuals who are closest to the “business side” of the project. They are charged by the organization to “get the product out” and are expected to do the best possible job of satisfying all the stakeholders. CSPOs maintain the product backlog and ensure that everyone knows the priorities.”
The course covered
Overview of Scrum
Scrum is empirical
The Scrum project community
Roles and Responsibilities
Team / ScrumMaster / Product Owner
Your role in the four Scrum meetings
Things that are not your job
Chartering the Project
Creating an “Igniting Purpose”
Five techniques
Estimating
Estimating the size of work
Planning Poker®
The Product Backlog
Emergent requirements
User stories on the product backlog
The product backlog iceberg
User stories in a formal contract
Sprints
What is potentially shippable?
Changes during the sprint
Sustainable pace & over commitment
Abnormal termination
Tracking Progress
Burndown charts
Taskboards
Prioritising
The proper level for prioritizing
Four factors to consider
Kano analysis
Theme screening and scoring
Relative weighting
Release Planning
Extrapolating end dates
Fixed-scope and fixed-price projects
Scaling the Product Owner
Sharing one product backlog
Visualizing a large product backlog
The scrum of scrums meeting
The chief product owner
Conclusions
I loved the course and would highly recommend it. I particularly found the session on Prioritisation one of the most valuable with the section on Kano Analysis being used in my recent presentation. I’ve also taken what I learnt in the Estimating session and delivered something internally with colleagues at Sigma to help the whole team to estimate better.
@JamieClouting Thanks, Jamie. I appreciate you participating this week. Now go order the team around just like I said a PO should do 😉
Last week I was lucky enough to present again at Camp Digital, a two-day event run by Sigma UK full of inspirational seminars and workshops discussing user experience, exploring key trends in our industry and connecting people in our community.
It’s the second year that I’ve been invited to speak, after my presentation last year on Rapid Prototyping.
Synopsis
Minimum Viable Product (MVP) is a key lean startup concept popularised by Eric Ries to maximise validated learning for the least amount of effort expended. No-longer just a concept used in the lean startup world, defining MVPs has become a popular product development strategy for agile teams around the world. But what’s the impact of constantly focusing on delivering the ‘minimum’ and do your users ever truly love your product as a result.
In this session Jamie will look at how your team can develop an MVP that both meets your business requirements and keeps your users coming back for more.
Presentation
Camp Digital – Manchester, UK Camp Digital returns as a two-day programme of inspirational seminars and workshops discussing user experience, exploring key trends in our industry and connecting people in our community.
In my last post I discussed designing for Mobile First. But before you can start designing for mobile, it’s a good idea to have an understanding of how users are using mobiles and tablets to interact with your website and consume your content. Although it is true that overall mobile and tablet usage is on the rise, different industries are seeing different usage of these device.
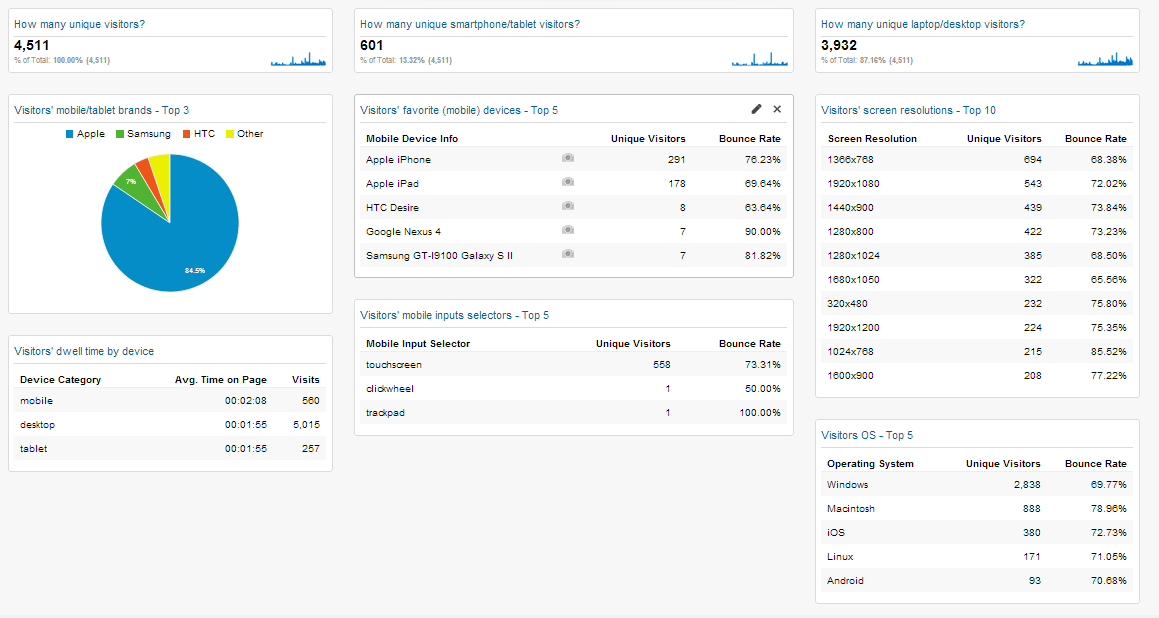
Using this Dashboard Junkie dashboard as a base, I was able to create a dashboard that attempted to answer a number of key questions designers may be asking when starting a mobile first project:
Which breakpoints are most popular on my website
Which browsers are we designing for (and testing in)
What input methods are users using
Try adding it to your Google Analytics account and let me know how you get on.
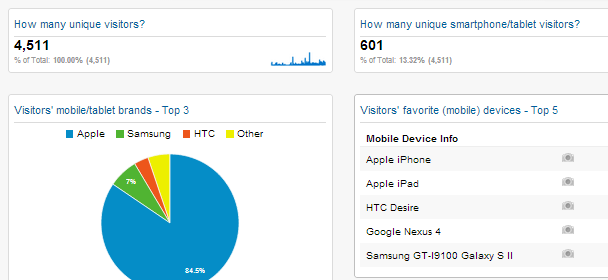
How many unique visitors?
Here you’ll see a count of how many different users (or computers/devices, really) that have visited your website.
How many unique smartphone visitors?
Here you’ll see how many of your visitors are using a smartphone or tablet to interact with your website and consume your content.
Only smartphones/tablets will relay their brand and model information to Google Analytics.
Laptops/desktop cannot be identified in such detail.
Tip: Click on the photo/camera icon and you will see one or more pictures of the hardware device in question.
Visitors’ screen resolutions – Top 10
Here you can check out the display resolution (measured in Pixels) of your visitors. This information can be very useful when making decisions about where to place your breakpoints.
Visitors’ favorite browsers
Here you can see the most popular browsers that users are using to view your website. This will help you to identify which browsers to prioritise testing on.
Visitors’ dwell time by device
Here you can see the average page view time by each device category. This information can be helpful to understand which devices users use when completing certain tasks on your website.
Visitors’ mobile inputs selectors – Top 5
Here you can see the input methods users use to interact with your website. You can use the information to make decisions about how to layout your navigation, input fields and button sizes.
Visitors mobile OS – Top 5
Here you can see the most popular operating systems used by your visitors. This information can be really helpful if you’re considering developing a mobile app and you want to know which platform to prioritise first.
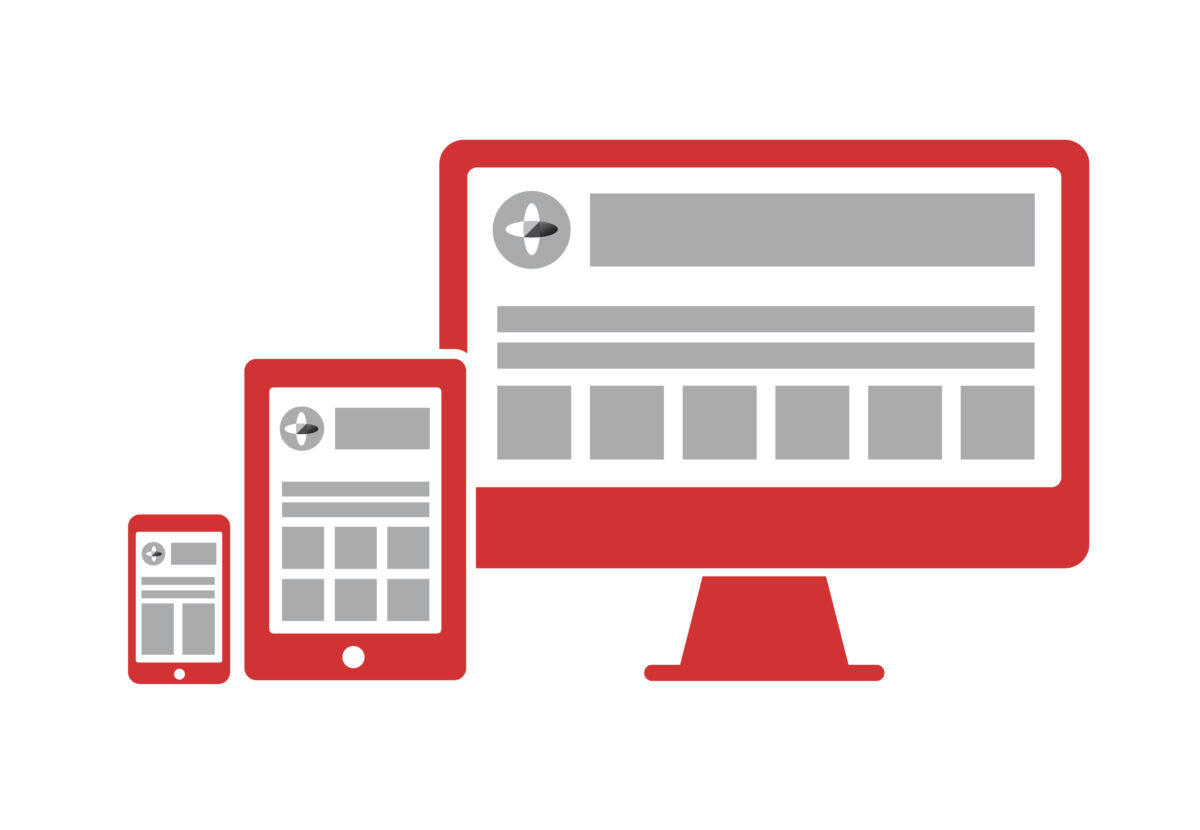
I’ve been playing with some of the latest Axure 7 features recently and one of my favourites is the new Adaptive Views feature. Adaptive Views define the breakpoints where you want your pages to switch to a different layout or style. This allows you to prototype in a way that forces you to consider your mobile and tablet experience. Former Yahoo! design architect Luke Wroblewski, coined the expression Mobile First to describe the process of designing websites and other software for the mobile first, rather than last (as can often happen).
Why’s it important?
While responsive web design is not entirely new, designers and developers have often struggled to demonstrate how a responsive site will look on different devices, prior to build. The options are usually to design up every view individually or to prototype in HTML & CSS. The former option often lacks any detail of how interaction will take place, whereas the latter often focuses too heavily on technical implementation and can sometimes overlook visual treatment and design aesthetics.
Prepares you for the explosive growth and new opportunities emerging on mobile today
Forces you to focus and prioritise your products by embracing the constraints inherent in mobile design
Allows you to deliver innovative experiences by building on new capabilities native to mobile devices and modes of use.
Axure allows UX and interaction designers to prototype with both realistic interactions and visual treatment. The outcome is a realistic representation of your website or application in a range of views, for different devices.
How it works
Adaptive views are based on browser/device width and/or height. Axure has a range of mobile and tablet dimensions (in both landscape and portrait orientation) predefined out of the box. Views inherit from one another so a change to the location, size, or style of a widget in the parent view affects its children, but a change in the child view does not affect the parent.
Editing a widget’s text, interactions, and other widget properties affects the widget in all views. The widget is the same widget across views (not a copy) so you only have to update the property once.
While most of the tutorials show desktop being created as the base view that all other views inherit from, I would encourage you to consider using the 320px width mobile portrait view as your base and inheriting up through the spectrum until you reach desktop. This will make your prototype truly mobile first and force you to consider interactions and behaviours that may get overlooked if you settle for a more traditional approach.
The prototype switches views based on the browser size or can be manipulated using the adaptive view icon in the left hand sitemap. I have hosted the Axure Learn example here.
What I’ve discovered
If you have been using Axure prior to version 7’s release this new feature shouldn’t take you too long to get to grips with. It is possibly quite advanced for novice users of Axure, but everyone has to start somewhere.
I noticed a significant performance drop in Axure when using a number of images and widgets across multiple views. I am hoping that future updates to Axure 7 will improve this.
Out of the box Axure doesn’t add a viewport tag like this to its HTML generated prototypes:
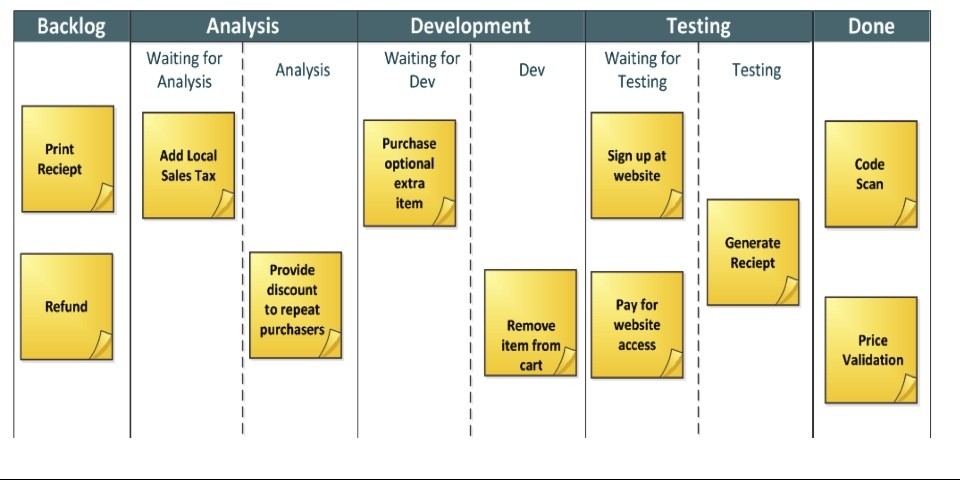
In the next couple of weeks I’ll be presenting at a ‘Lightning Lunch’ at Sigma UK on Kanban and how you can optimise the flow of tiny tasks (stories) to make predictable deliverables. This presentation is based on a blog post I wrote some time ago on the same subject.
I’m currently working on a very large Scrum programme that uses a board very similar to a Kanban board, however, we’re not enforcing WIP limits and we only ship things once a sprint. While this in itself feels very fast and very agile to some, it’s not without risks and sometimes feels a little ‘big bang’ release due to the amount of code that is getting delivered in a single sprint. This got me thinking about the continuous test and deployment cycles within Kanban teams as a potential enhancement to our current process.
Kanban doesn’t pretend to solve the problems, but it does allow teams to focus on continuous delivery and continuous improvement. It encourages teams to work as a multi-disciplinary unit rather than as a collection of silos and functions.
I should say that I have only ever done this ‘agency-side’ and as a result commercial constraints sometimes limit our ability to apply too aggressive WIP limits. I’d be really interested in hearing from anyone who has experience of running Kanban projects for multiple customers within a software/design agency. I’m sure there is some additional tweeks to help the implementation.

 We’re hiring! at Laterooms.com